Dynamic Dashboard Dates
Thu Jul 11 2024
How to use SQL functions within Vantagepoint's standard interfaces to make date and deadline calculations.
Written by: Wesley Witsken

How to Make Dynamic Deadline Calculations in Deltek Vantagepoint Dashboards
Introduction
Deltek Vantagepoint is a comprehensive software solution tailored to meet the needs of professional services firms. Its modern design and time-tested database capabilities make it an indispensable tool for accounting, resource planning, and customer relationship management (CRM). Vantagepoint offers an all-in-one solution that streamlines these essential functions, enhancing productivity and efficiency across various business operations.
Vantagepoint also implements Dashboards to efficiently present relevant business data to decision makers. Dashboards offer extensive customization options, allowing users to examine various metrics from other hubs very easily and quickly. Furthermore, because they are integrated tightly with the database, they are the most reliable data presentation method and are updated regularly. They are also extremely convenient, because the user doesn’t have to leave the Vantagepoint application to analyze data. However, being interconnected in the system comes with some drawbacks. Dashboards aren’t as fully-fledged as other data analysis tools like Excel, Power BI, or Informer. They also impose stricter limitations on data manipulation because of security and complexity issues.
Sometimes, users seek to implement solutions in Dashboards that stretch their intended functionality. This is especially common with users who are seeking to migrate external BI tools solutions into a Vantagepoint environment. While Dashboards can handle wide array of use-cases, they sometimes fall short of addressing specific needs because of their limitations. Often, those solutions are impossible to implement, at which point we point to custom external BI solutions that connect to Vantagepoint data. However, there are ways to extend the functionality of Dashboards, and with a little problem-solving and SQL code, we can create solutions to meet unique business requirements without using external software.
For example, several users have sought to create Dashboards that rely on tracking deadlines. They want to use the current date as a reference point to see how far out these deadlines are, and build logic into a Dashpart to communicate that data. This functionality isn’t built into Dashparts by default, but can be implemented via Calculated Fields. In this guide, I will demonstrate how to use simple SQL functions within Vantagepoint’s standard interfaces to make date and deadline calculations. This approach requires no custom development and is intended for intermediate to advanced users who are familiar with workflows, dashboards, and custom field creation. By following these steps, you will be able to create dynamic calculations based on current date-times, enhancing your dashboard’s functionality and improving your ability to manage project deadlines effectively.
Problem and Limitations
While Vantagepoint allows significant customization of dashboards, it also imposes some limitations. For instance, dynamically calculating the time until deadlines requires a specific data point in the dashpart to hold that value. Unfortunately, Vantagepoint dashpart fields do not automatically provide this functionality, necessitating the creation of custom calculated fields.
Vantagepoint calculated fields use SQL expressions but are limited to returning numerical or percentage values, not dates. This constraint prevents direct date comparisons within dashboards. To work around this limitation, we can use SQL expressions to perform date comparisons within the calculated field and return numerical values that can be used in dashpart logic.
Create the Dashboard
To navigate the limitations of Vantagepoint dashboards, we will use simple SQL expressions to compare dates within the calculated field and return numerical values. These values can then be used for conditional formatting, grouping, filtering results, and other calculations. This approach enables us to enhance the functionality of Vantagepoint dashboards without requiring extensive custom development.
Step 1: Create a Custom Date Field
Imagine you have a custom date field named “CustDeadline” in your projects hub for projects. Users enter a future date to define the deadline for various project milestones. This field will serve as the basis for our dynamic deadline calculations.
Step 2: Create a Dashpart
To begin, we need to create a dashpart that includes the relevant project information and the custom deadline field. Follow these steps:
-
Go to the Dashboard section of Vantagepoint.
-
Click New Dashpart to create a new dashpart.
-
For Dashpart Base, choose Project.
-
For Dashpart Type, select Table (for demonstration purposes; the same principles can be applied to charts).
-
Choose Columns to include:
-
Project Name
-
Your Custom Deadline field (e.g., CustDeadline)
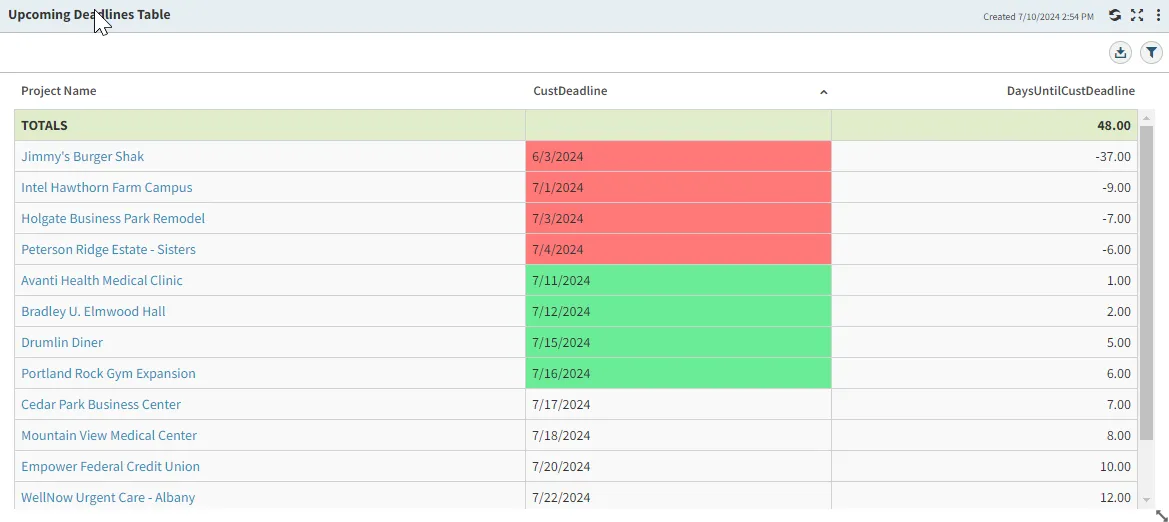
Now, you have a table that shows the project name and the custom deadline date field. Next, we’ll add a field that shows how many days are left until the deadline.
Step 3: Create a Calculated Field
To calculate the number of days from today until the “CustDeadline,” follow these steps:
-
In the Dashpart Designer, click the Calculated Field button.
-
Choose New Calculation OR New Dashpart Calculation:
-
A Calculation makes this datapoint available to all dashparts.
-
A Dashpart Calculation restricts the datapoint to the current dashpart, which helps avoid system clutter.
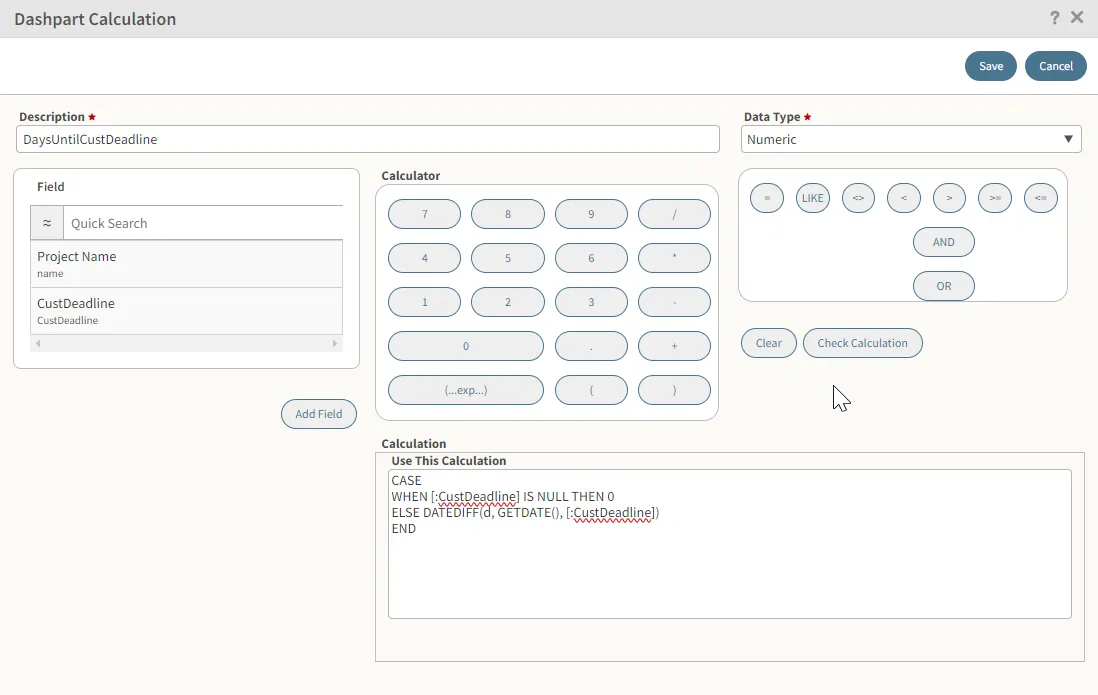
- In the Calculation (or Dashpart Calculation) dialogue box:
-
Add a description, like “DaysUntilCustDeadline.”
-
Ensure the data type is Numeric (default).
-
In the “Use This Calculation” field, add the following SQL snippet:
CASE
WHEN [:CustDeadline] IS NULL THEN 0
ELSE DATEDIFF(d, GETDATE(), [:CustDeadline])
END
This SQL code ensures that if the CustDeadline field is empty, the value defaults to 0. If there is a value, it calculates the number of days between today (GETDATE()) and CustDeadline using the DATEDIFF() function.
- Click the Create Calculation button. The field will automatically be added to your selected columns in the table. Save your changes and return to the Dashboard to see the new field with DaysUntilCustDeadline.

Step 4: Add Logic to the Table
Now that we have the DaysUntilCustDeadline field, we can add logic to highlight the CustDeadline column values based on how close the deadline is:
-
Re-open the Dashpart Designer dialogue for the table.
-
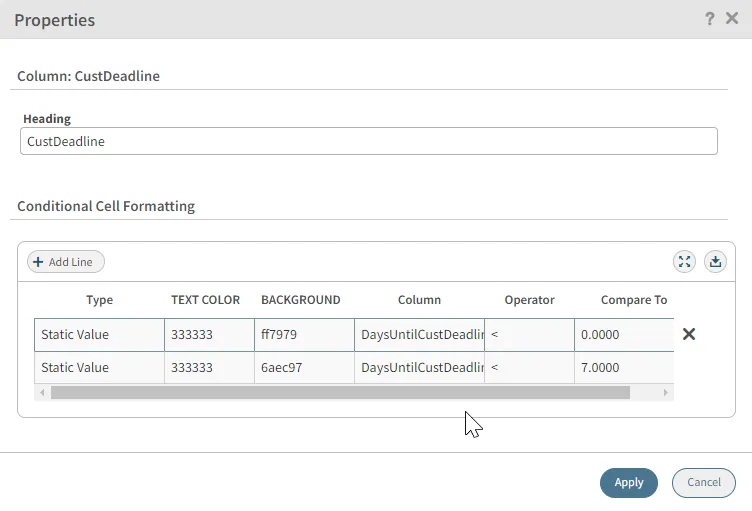
For the CustDeadline column, click the Properties pencil icon to open the Properties dialogue box.
-
In the conditional cell formatting section, add the following items (Make sure they follow this order!):

-
Static Comparison: If DaysUntilCustDeadline < 0, set the background to red using the color picker.
-
Static Comparison: If DaysUntilCustDeadline < 7, set the background to green using the color picker.
- Save your changes and return to the Dashboard page. The highlighted cell options should now be formatted accordingly.

Enhancing the Dashboard with Additional Logic
Beyond basic conditional formatting, there are other enhancements you can make to your dashboard using the calculated field. Here are a few examples:
Grouping and Filtering Results
Using the DaysUntilCustDeadline field, you can create more sophisticated groupings and filters to manage your projects effectively:
- Group Projects by Deadline Proximity:
-
Create groups based on how many days are left until the deadline. For example, group projects into categories such as “Due This Week,” “Due Next Week,” and “Overdue.”
-
This allows for a quick overview of project statuses and helps prioritize tasks.
- Filter Projects by Urgency:
-
Use the DaysUntilCustDeadline field to filter projects that are due within a specific timeframe, such as the next 7 days.
-
This filter helps focus attention on the most urgent projects, ensuring that deadlines are not missed.
Creating Additional Calculations
The flexibility of calculated fields allows for the creation of additional calculations that can enhance project management. For example:
- Create a Chart Of Upcoming Deadlines Grouped By Week:
-
Create new calculated fields that count how many projects have a deadline coming in the next week, 2 weeks, 3 weeks, etc.
-
These calculations can be put into a column bar chart to demonstrate the pipeline of upcoming deadlines, and identify any anomolies (such as too many deadlines in one week).
-
The following example demonstrates a “ProjectsOneWeekOut” calculated field. For X weeks out, change the “IS 1” to “IS X.”
CASE
WHEN [:CustDeadline] IS NULL THEN 0
WHEN (DATEDIFF(ww, GETDATE(), [:CustDeadline]) IS 1 THEN 1
ELSE 0
END
- Each of these calculated fields then becomes a column in your bar chart.
- Highlight Projects at Risk:
-
Identify projects that are at risk of missing their deadlines by calculating the ratio of completed tasks to the total number of tasks.
-
Use this ratio to apply conditional formatting, highlighting projects that are falling behind.
Additional Notes
Here are some additional tips to optimize your use of calculated fields in Vantagepoint dashboards:
- Filtering Out Projects without Deadlines:
-
In the Dashpart Designer, consider setting your selected search filter to exclude projects without a CustDeadline entry. This prevents clutter and makes it easier to sort by due dates.
-
Alternatively, modify the SQL code to default to an extremely high positive number or low negative number. This enables more logical project sorting and ensures that projects with defined deadlines are prioritized.
CASE
WHEN [:CustDeadline] IS NULL THEN 9999
ELSE DATEDIFF(d, GETDATE(), [:CustDeadline])
END
- Hiding Calculated Fields:
- You might want to hide the calculated DaysUntilCustDeadline field if you apply your formatting to the CustDeadline field. This reduces visual clutter on the table and ensures a cleaner presentation.
- Using Dashpart Calculations:
- When creating calculated fields, consider using dashpart calculations to limit the scope of the calculation to the current dashpart. This helps avoid system clutter and ensures that calculations are relevant to the specific dashboard.
Conclusion
By leveraging SQL expressions within Vantagepoint’s calculated fields, you can create dynamic deadline calculations and enhance your dashboard’s functionality. This approach allows for more sophisticated reporting and better project management, ensuring that you can keep track of important deadlines efficiently.
With these techniques, you can transform your Vantagepoint dashboards into powerful tools for managing project deadlines. Whether you are highlighting urgent tasks, grouping projects by deadline proximity, or creating additional calculations, the flexibility of calculated fields provides extensive possibilities for customization. Embrace these strategies to maximize the potential of Deltek Vantagepoint and improve your overall project management processes.